

Win, Lose, or Draw?
Our second half inventory math

Well, I was supposed to take some time off, but I do love writing about oil, and lots has happened as we have crested into the second half — including the calls for monumental draws getting louder by the day, so today, lets discuss the risk to that.
There’s not much in the market I want to focus on, besides OECD visible inventories — and how non-OECD movement filters back into those balances. May eyes are, exhaustingly, back on China. The “destocking” narrative of the first half of the year has borne little fruit, and here we are in the second half, and barely able to hold $70/bbl on news that Russia and Saudi Arabia are going to continue to keep 1.5mb/d from the market. Wild. Either way, we have heard we are going to be in a deficit between 1-2mb/d in the second half — I don’t buy it, and, I also think, there’s a good chance that even with draws, we can see prices generally in check. Not only has it happened before, but draws with flat prices usually happen when inventories are still elevated relative to the 10yr average (where we are now), and when the macro look-through is not exceedingly bullish. The pace of draws, a derivative of the inventory levels themselves, is what really, everyone is intently focused on over the coming months, and while most people are focusing on one factor (such as flights returning from China, or strong vehicle miles traveled from the United States), we’ve debunked those hyper-focused claims of market strength (recall, in Rig Realism, the full return of China air travel to the 2016-2019 trend would add <250kb/d of demand), when, the fact is the crude market stands in a place of generally being balanced while ex-USA developed economies start to flash warning signs, and pockets of the refining complex are also not exactly inspiring confidence. With additional risk to the downside, both on the demand side (China, Europe, even the US), and supply side (Kazakhstan turn in line, Iran, crude on water) — I don’t see the monumental draws most bulls are hoping for — so in this edition we will work backwards from the expected draws, consider pockets of market weakness, and strength, and their contribution to the overall market (instead of submitting the intellectually weak argument which is simply focusing on the pockets of strength/weakness); and specifically, OECD inventories.
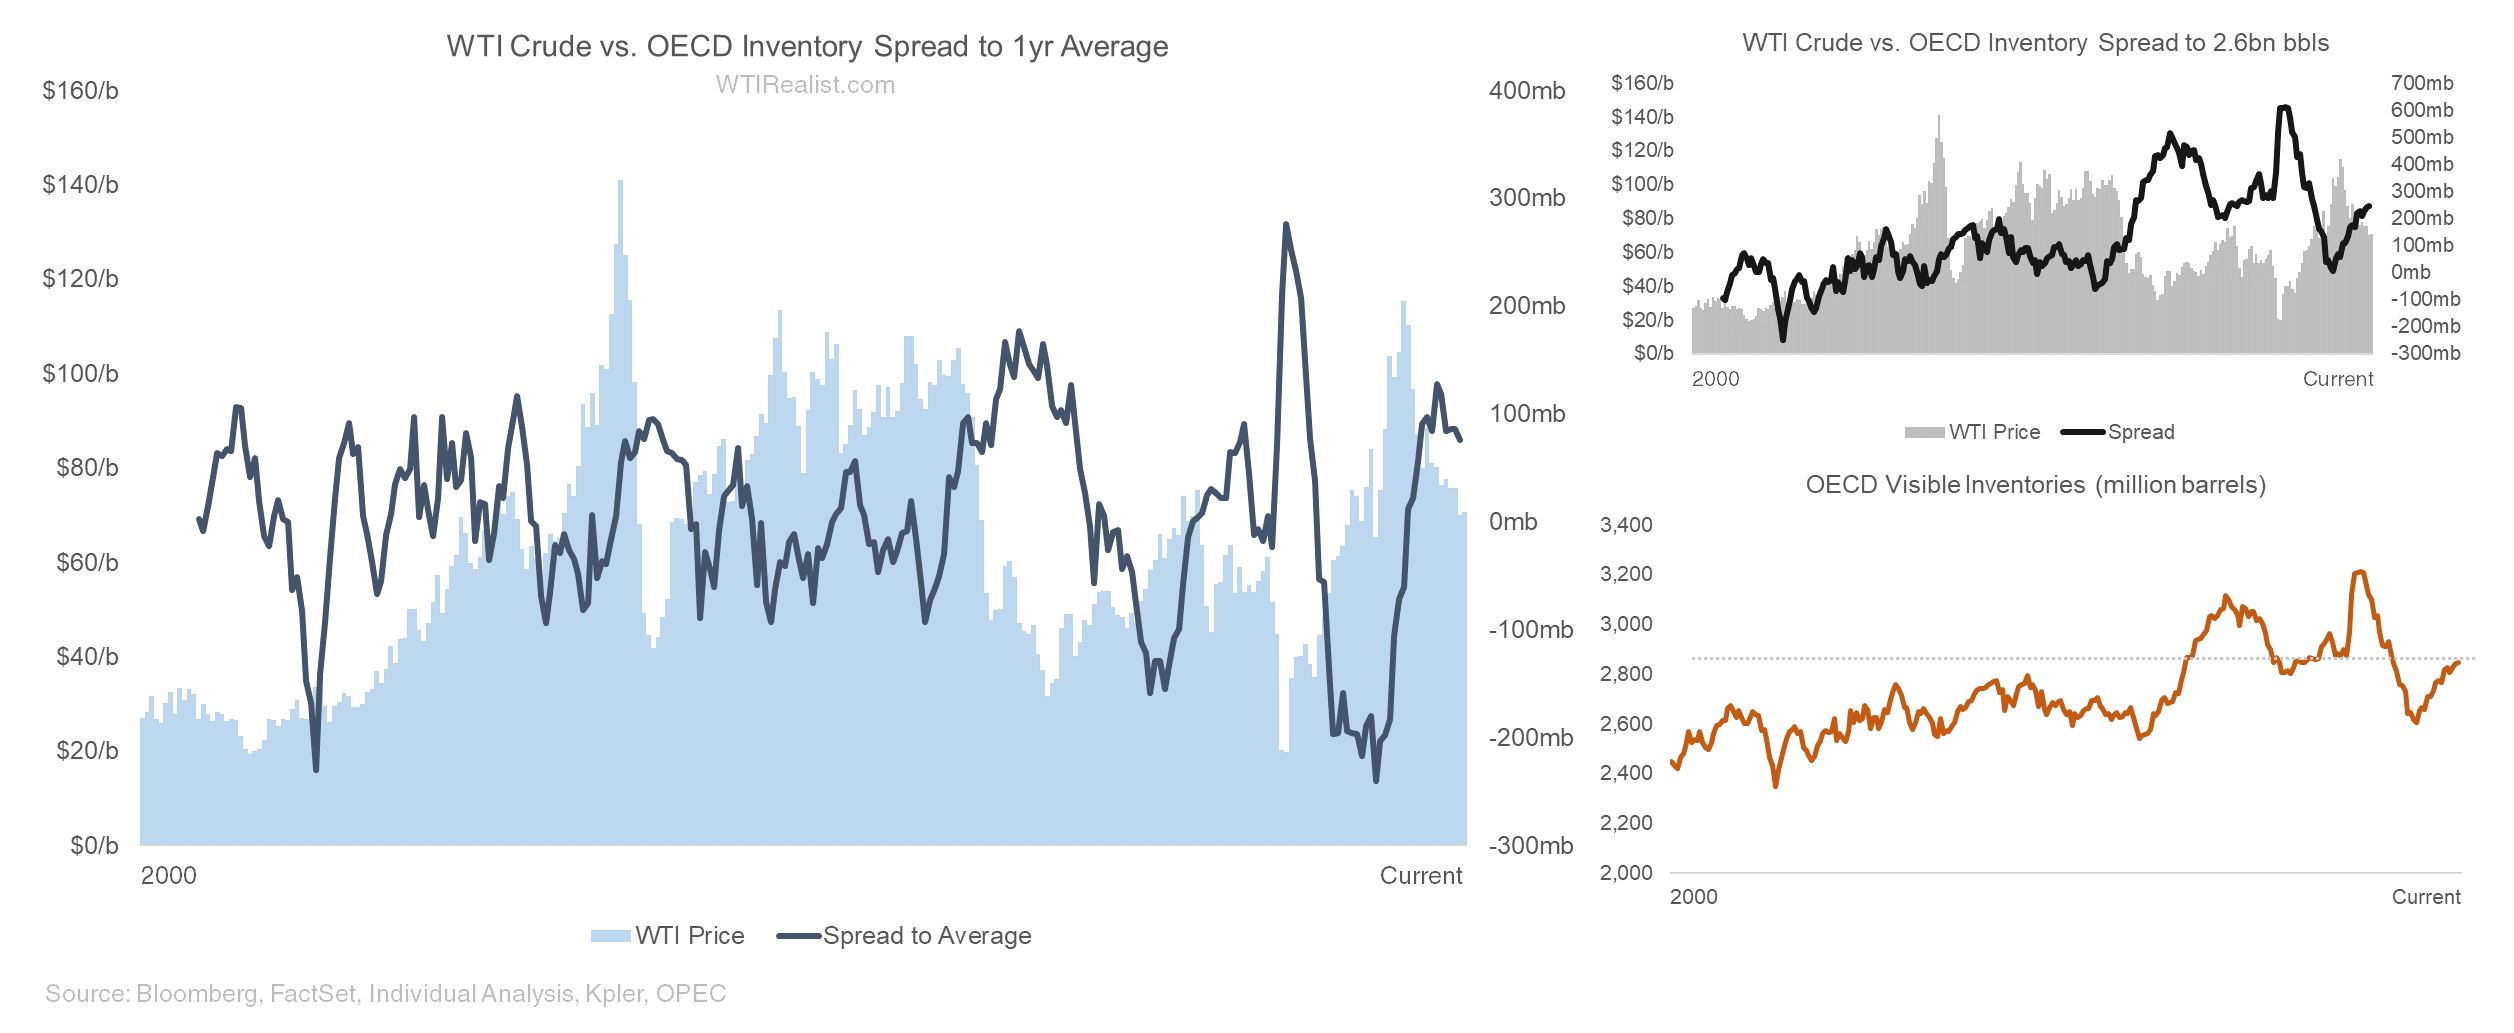
Below charts OECD inventories, the correlation is pretty obvious — more inventory, lower prices — and we have added inventory pretty quickly over the past few months. Even more interesting, is when you add rest of world commercial inventories, the picture is even worse — as the market has transitioned from keeping stocks in developed countries pre-2010, to stockpiles in eastern hemisphere countries (those driving most of the demand growth) increasing in size. So to return to a 2010-2014 OECD inventory level, to me, is a relatively competent factor to track — OECD demand has been relatively flat over the past decade, and that spread to a magical 2.6bn barrels in inventory is something I track closely. Now, given that more inventory is being held east of Suez, it becomes marginally less useful, nonetheless — the crux of the second half is that we are going to be drawing inventories, and hard.
RBC is calling for >350mb of draws (which equates to ~2mb/d), and other research houses are expecting similar. Me — not so much. If you work backwards, and don’t assume that current China performance indicators are sustainable (I don’t think they are, and I’ll explain why), the outlook for the second half, while still likely undersupplied, is not even close to as tight as many would have you believe — and again, when looking through to a bleaker market in 2024, there’s a good chance we see draws, yet little change in prices further down strip. The charts below show total global commercial inventories — my base case, for the second half, includes the eastern hemisphere (mainly China) balancing the market, along with OPEC, through decreased imports, and some inventory draws.